Subscribe to wiki
Share wiki
Bookmark
Candlesticks
The Agent Tokenization Platform (ATP):Build autonomous agents with the Agent Development Kit (ADK)
0%
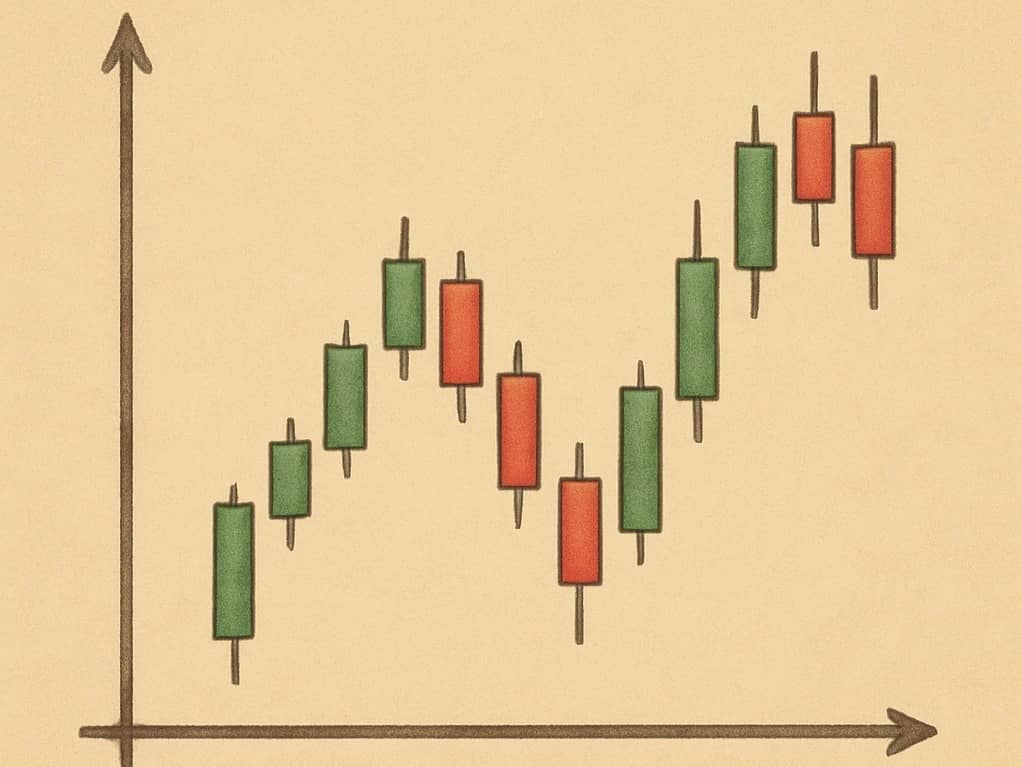
Candlesticks
Candlesticks are graphical representations used in financial markets to display price movements of assets over specific time periods. They originated in Japan for rice trading and have become essential tools for cryptocurrency traders to analyze market sentiment and predict potential price movements. [1] [2]
Overview
Candlestick charts provide a visual method for displaying price information that includes opening price, closing price, high, and low values within a defined timeframe.
Developed by Japanese rice traders in the 18th century, candlesticks have evolved into one of the most popular and effective tools for technical analysis in modern financial markets, including cryptocurrency trading [1].
Their visual nature allows traders to quickly interpret market sentiment and identify potential trend reversals or continuations, making them particularly valuable in the volatile cryptocurrency markets where rapid decision-making is often necessary.
Candlestick analysis is considered a "leading" indicator rather than a "lagging" one, meaning it can potentially signal future price movements before they fully materialize. This characteristic makes candlestick pattern recognition an essential skill for cryptocurrency traders who need to anticipate market changes in a highly dynamic environment [1].
Anatomy of a Candlestick
A candlestick consists of several key components that together provide comprehensive price information:
Body
The most visible part of the candlestick, representing the range between the opening and closing prices during the specified time period. The body's color indicates whether the price increased or decreased during that period [2].
Wicks (Shadows)
The thin lines extending above and below the body represent the highest and lowest prices reached during the time period. The upper wick shows the highest price, while the lower wick shows the lowest price [3].
Color Coding
- Bullish candle: Typically green or white, indicating that the closing price was higher than the opening price (price increased)
- Bearish candle: Typically red or black, indicating that the closing price was lower than the opening price (price decreased) [4]
Types of Candlesticks
Different candlestick formations provide specific insights into market conditions:
Long Candles
Candlesticks with large bodies indicate significant price movement between opening and closing prices. A bullish long candle suggests strong upward movement, while a bearish long candle indicates substantial selling pressure [4].
Short Candles
These have smaller bodies, showing little difference between opening and closing prices. They often indicate market consolidation or a pause in the trend, suggesting low volatility [4].
Doji Candles
A Doji has almost no body because the opening and closing prices are nearly identical. This pattern signals market indecision and potential trend reversal or consolidation. The Japanese term "doji" means "equal" or "undecided" [4].
Spinning Top Candlesticks
These have small bodies with long wicks above and below, indicating uncertainty in the market as neither buyers nor sellers dominate. They can appear in both bullish and bearish trends and often suggest potential sideways movement [4].
Marubozu Candlesticks
These have no wicks and consist only of a full body. A bullish Marubozu closes at the highest point, indicating strong buying pressure, while a bearish Marubozu closes at the lowest point, showing strong selling pressure. The Japanese term "marubozu" means "bald" or "without hair" [4].
Candlestick Patterns
Candlestick patterns are formations created by multiple candlesticks that can signal potential market movements:
Bearish Candlestick Patterns
These formations indicate potential downtrends and often emerge at the end of an uptrend, signaling a possible market reversal. A common example is the Bearish Engulfing Pattern, where a smaller bullish candle is completely "engulfed" by a larger bearish candle [4].
Bullish Candlestick Patterns
These patterns suggest potential upward trends and often occur after a downtrend, indicating that buyers are gaining control. The Bullish Engulfing Pattern is a typical example, where a large bullish candle completely "engulfs" the body of the preceding smaller bearish candle [4].
Reading Candlestick Charts
Understanding how to interpret candlestick charts is crucial for effective technical analysis:
Timeframes
Candlestick charts can represent various time periods, from minutes to months. The timeframe affects the significance of patterns - patterns on longer timeframes (daily, weekly) generally carry more weight than those on shorter timeframes (minutes, hours) [4].
Trend Identification
By observing sequences of candlesticks, traders can determine if the market is in an uptrend, downtrend, or moving sideways. Consecutive green candles suggest an uptrend, while consecutive red candles indicate a downtrend [4].
Pattern Recognition
Identifying specific candlestick patterns helps traders anticipate potential price movements. For example, a Bullish Engulfing Pattern might suggest an upcoming uptrend, while a Doji formation could indicate market indecision and a potential trend reversal [1].
Volatility Assessment
The length of wicks provides insight into market volatility. Long wicks indicate that prices reached significantly higher or lower levels before returning to the opening/closing range, suggesting high volatility. Shorter wicks indicate less volatility [3].
Importance in Cryptocurrency Trading
Candlestick charts are particularly valuable in cryptocurrency trading for several reasons:
Market Sentiment Analysis
Candlesticks provide visual cues about market sentiment, helping traders gauge whether buyers or sellers are in control. This is especially important in the cryptocurrency market, which can experience rapid sentiment shifts [2].
Early Trend Detection
As leading indicators, candlestick patterns can signal potential trend reversals before they fully materialize, giving traders an edge in the fast-moving crypto markets [1].
Integration with Other Indicators
Candlestick analysis can be combined with other technical indicators such as volume, moving averages, or momentum oscillators to create more comprehensive trading strategies. This multi-faceted approach helps traders make more informed decisions in the complex cryptocurrency market [4].
Adaptability to Different Trading Styles
Whether a trader focuses on day trading, swing trading, or long-term investing, candlestick charts can be adjusted to different timeframes to suit various trading strategies. This flexibility makes them useful for all types of cryptocurrency traders [4].
Historical Context
The candlestick charting technique originated in Japan during the 18th century, developed by rice traders to track market prices and patterns. Munehisa Homma, a legendary rice trader from Sakata, is often credited with creating this method. The technique was later introduced to the Western world in the 1990s by Steve Nison and has since become a fundamental tool in technical analysis across various financial markets, including the emerging cryptocurrency sector [4].
See something wrong?
The Agent Tokenization Platform (ATP):Build autonomous agents with the Agent Development Kit (ADK)